
Recessions are easy to forecast, so how can CEOs better prepare to weather the economic storm?
‘A rising tide lifts all boats’ is an aphorism associated with the idea that good CEOs can drive business growth during the good times. However, in my experience…
exceptional CEOs drive remarkable growth during economic downturns!
No matter what anyone tells you, recessions are easy to forecast. It’s the severity of the recession that is difficult to predict. One of the most watched charts in economics is the 10-year US treasury interest rates minus the 2-year US treasury interest rates (a.k.a. Yield Curve chart), which has a near-perfect record of forecasting recessions. The yield chart is currently flashing a ‘code red’ highlighting a recession is highly likely within the next 12-18 months. However, it is not all doom and gloom!
Smart CEOs can leverage the yield curve date to ensure their businesses are fortified to weather the upcoming economic storm. As shown on the chart, building financial and operational resistance should be a key priority of executives whilst the yield curve remains inverted!
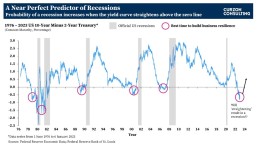
What is yield curve inversion, and why does it matter?
To simplify… the chart shows the 10-year US treasury interest rates minus the 2-year US treasury interest rates. In a normally functioning economy, the longer the bond maturity, the higher the interest rate (yield) demanded by investors. Investors seek higher returns on longer maturing binds as risks become more difficult to anticipate the longer the term extends into the future.
However, when investors are worried about the economy, they get concerned with the ‘here and now’. Therefore, investors demand higher interest rates on short-term maturities; hence, an inversion between the 10-year and the 2-year interest rates takes place.
An inversion occurs when the 10-year US treasury interest rate minus the 2-year US treasury interest rate falls below zero.
Pre-1990s, recessions were recorded whilst the yield curves were inverted (i.e. below the zero line). Post-1990s, all recessions were recorded after the yield curves straightened (post the initial inversion).
As of 6th January 2023, the yield inverted at -0.69. This inversion is flashing a major warning signal! If history repeats again, there is likely to be a recession once the yield curve straightens again.
The question is… how deep will the recession be? That’s hard to forecast, but the current inversion rate is much deeper than what we’ve post-1990. If the inversion continues to deepen similar to the early 1980s, we could potentially see a large recession following.
So what?
As highlighted on the chart, the best time to start a business transformation programme and build financial and operational resilience is when the yield curve is inverted and well BEFORE it straightens again (i.e. rises above the zero line).
CEOs and CFOs should utilise the yield curve chart to kick start or accelerate an existing business transformation programme, well before a recession arrives.
If you are interested in learning more, please get in touch


CONTACT US TO FIND OUT HOW WE CAN HELP